The reasons are in the connections
In 1736, the people of Königsberg had a puzzle. Their city sat on both banks of the river Pregel and on two islands in the middle, joined by seven bridges. Could you take a walk that crossed every bridge exactly once? Nobody had managed it, and nobody could say why not.
Leonhard Euler did not answer with a better map. He set the map aside. He gave each of the four pieces of land a letter and treated each bridge simply as a connection between two of them. The streets, the distances and the shape of the river no longer mattered. Only the connections did, and the answer was in them. Every piece of land touched an odd number of bridges, and a walk like that is only possible when no more than two of them do. No such walk could exist. Euler proved it without taking a step.
Today we draw his idea as points joined by lines, and we call it a graph. His insight was simple: some questions are not answered by more detail. They are answered by seeing how things connect.
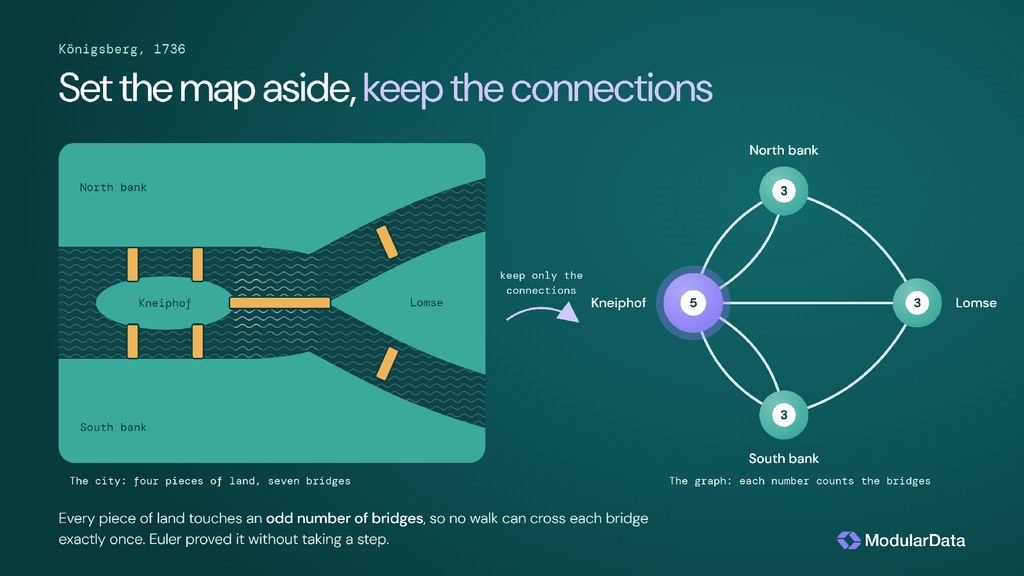
Euler set the map aside and kept only the connections.
It’s all relationships
In 2016, 280 years later, journalists faced the Panama Papers: more than 11.5 million leaked records from the law firm Mossack Fonseca. Reading them one by one was never an option. The International Consortium of Investigative Journalists loaded the people, companies and addresses into a graph, and reporters around the world followed the lines between them. As Mar Cabra, who led its data and research unit, put it, a graph was the best way to explore the data “because it’s all relationships”.
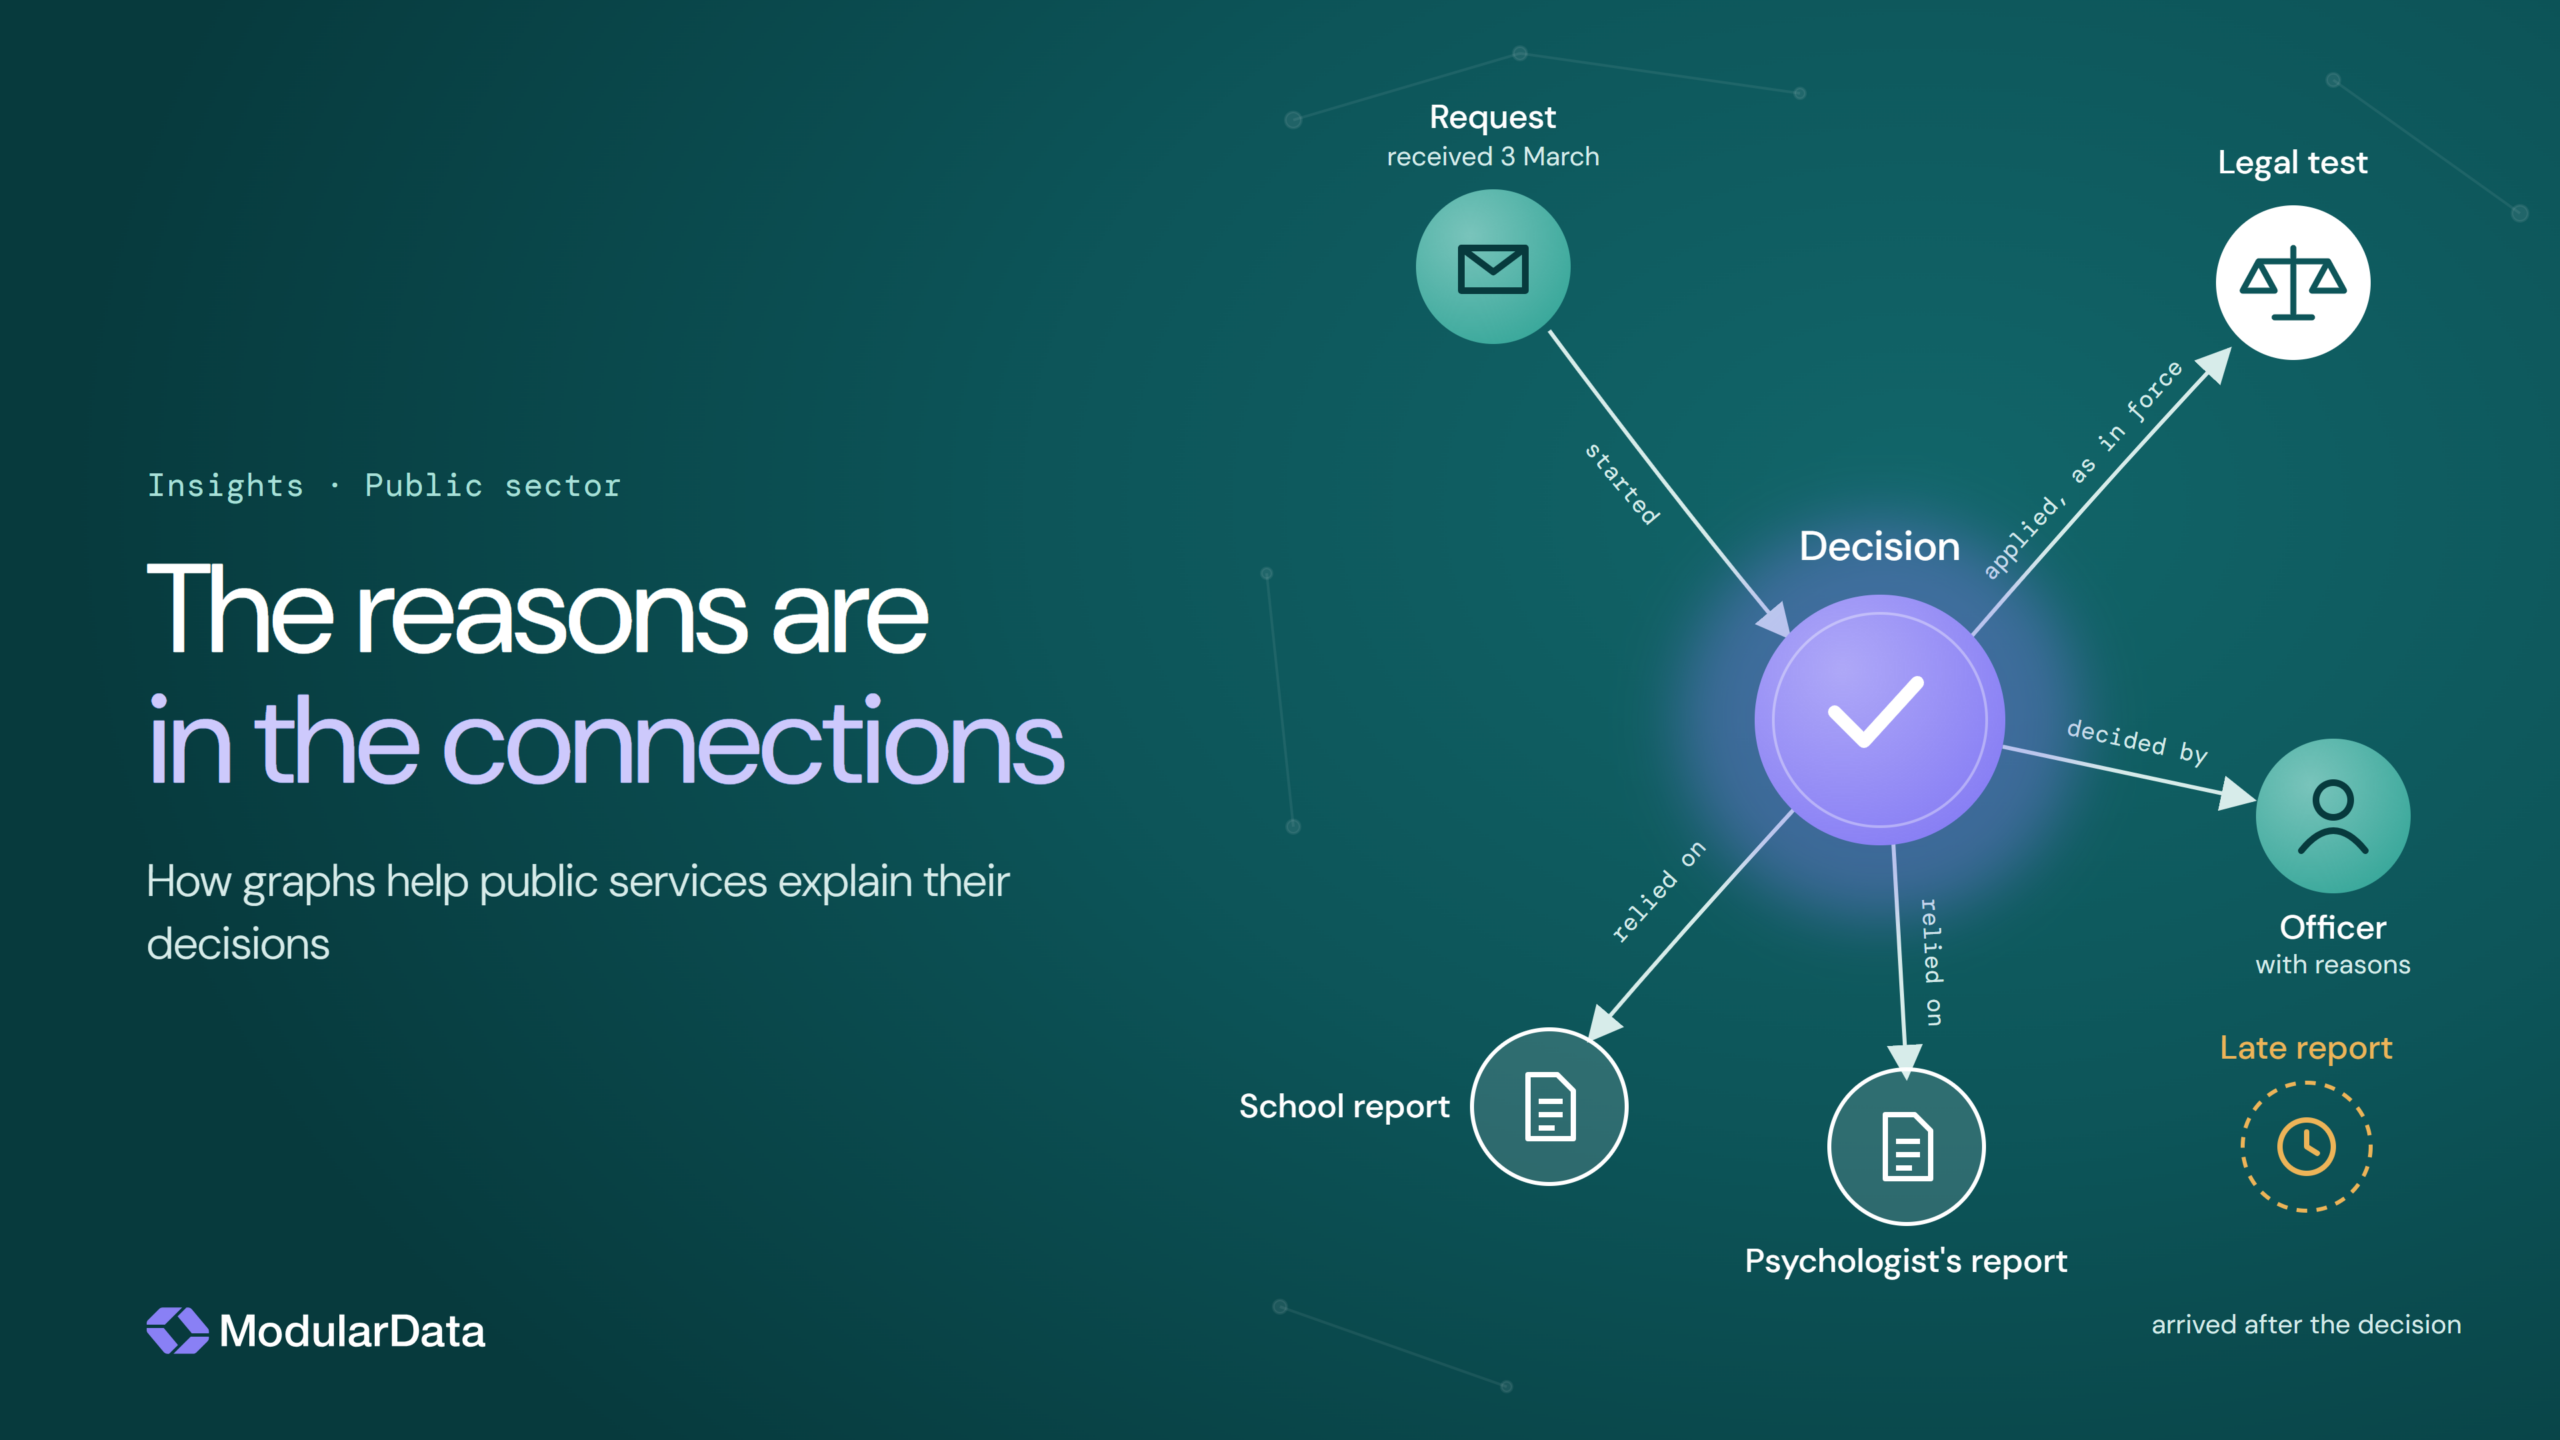
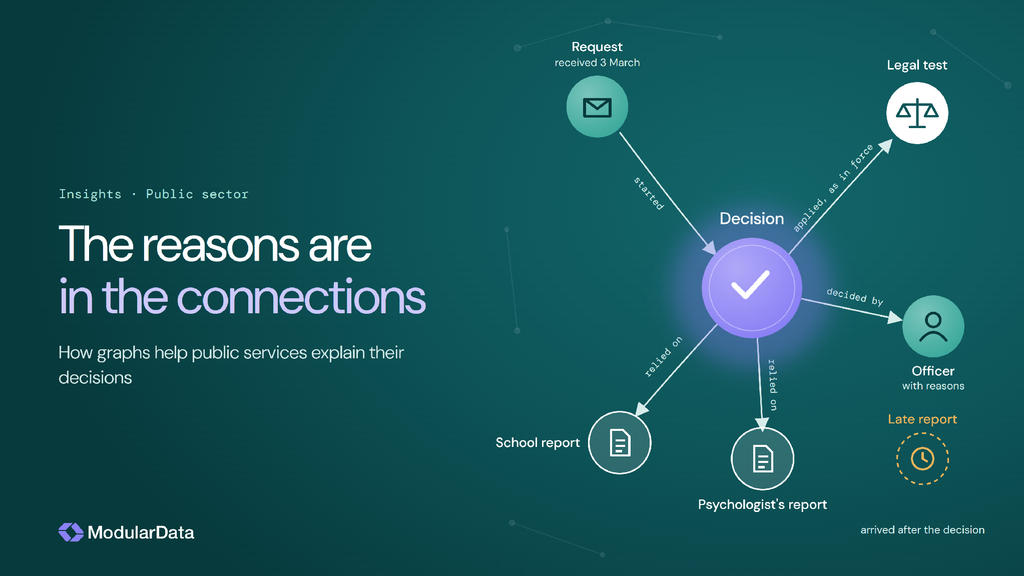
Public decisions are made of relationships too. A decision rests on facts. The facts come from documents. The documents arrived on certain dates. A rule applied on the day, and a person decided. Those connections are the reasons for the decision. We just rarely draw them.
When decisions are tested
The cost shows when a decision is challenged. Between April and June 2026, the social security tribunal heard around 20,000 appeals against benefit decisions. In six out of ten, the original decision was revised in the claimant’s favour. For Personal Independence Payment, it was two out of three.
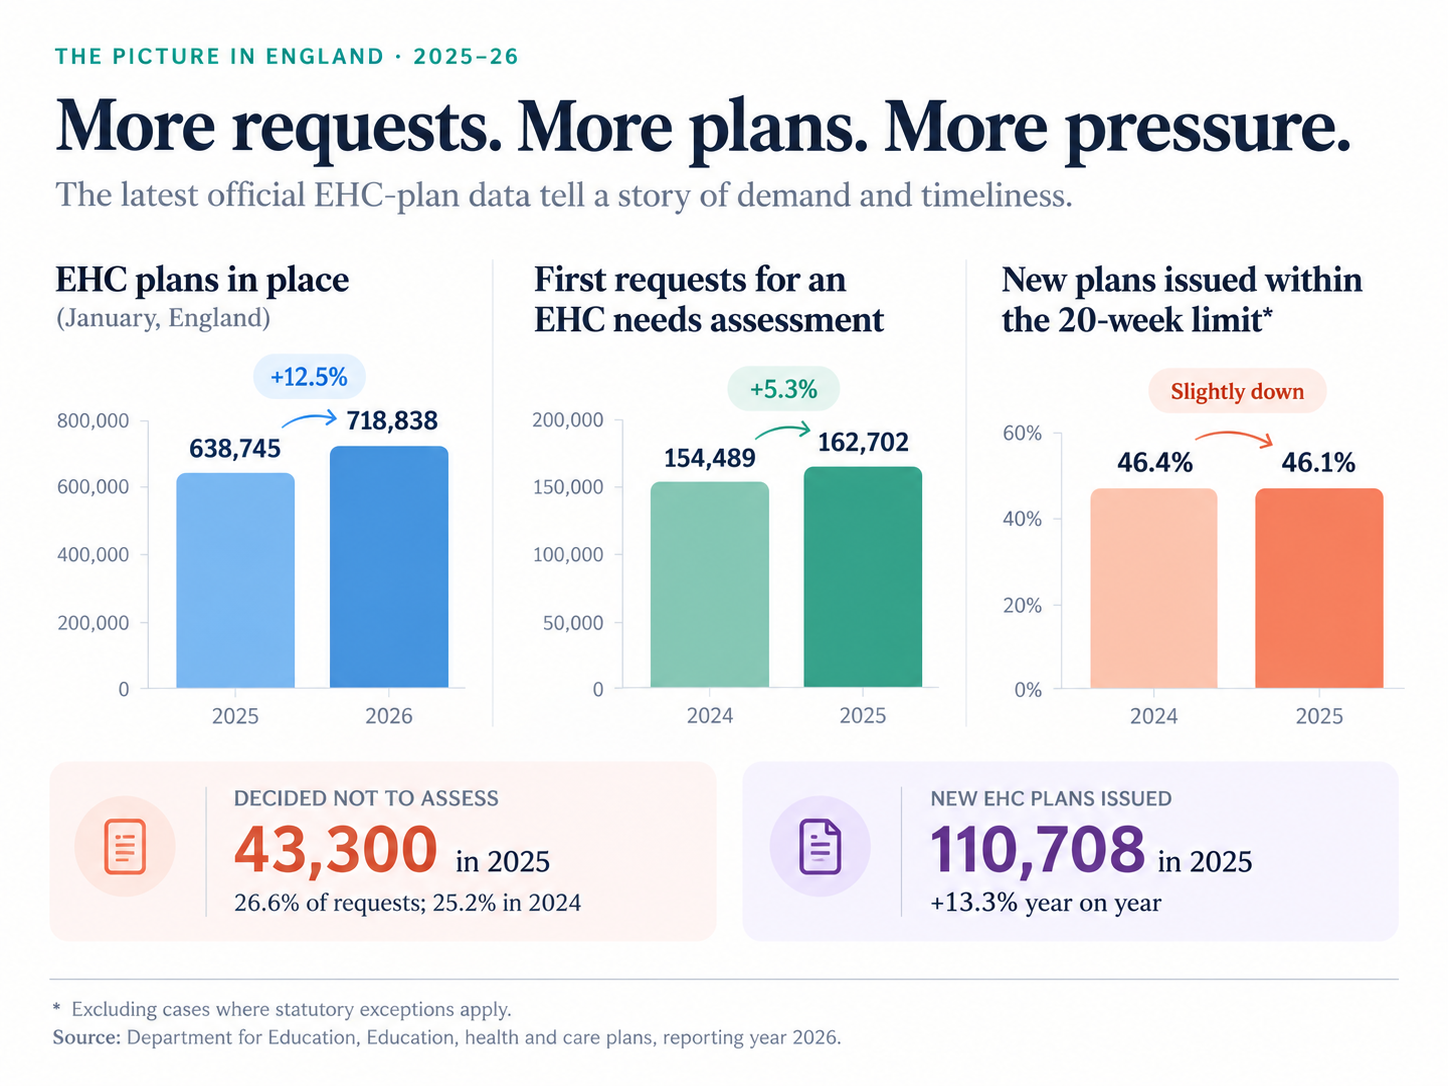
That does not mean most benefit decisions are wrong. Most are never appealed, and a tribunal often hears evidence that the original decision-maker never saw. But when a decision fails, it is hard to say why. Was the evidence missing? Was the test misapplied? Or were the reasons never written down? The same questions come up in other services, including special educational needs, where we are working now.
This is what decision assurance is about: being able to show, for any decision, what it rested on, who made it, which rules applied and what was known at the time. Euler’s idea, nearly 300 years old, is one of the best tools we have for it.
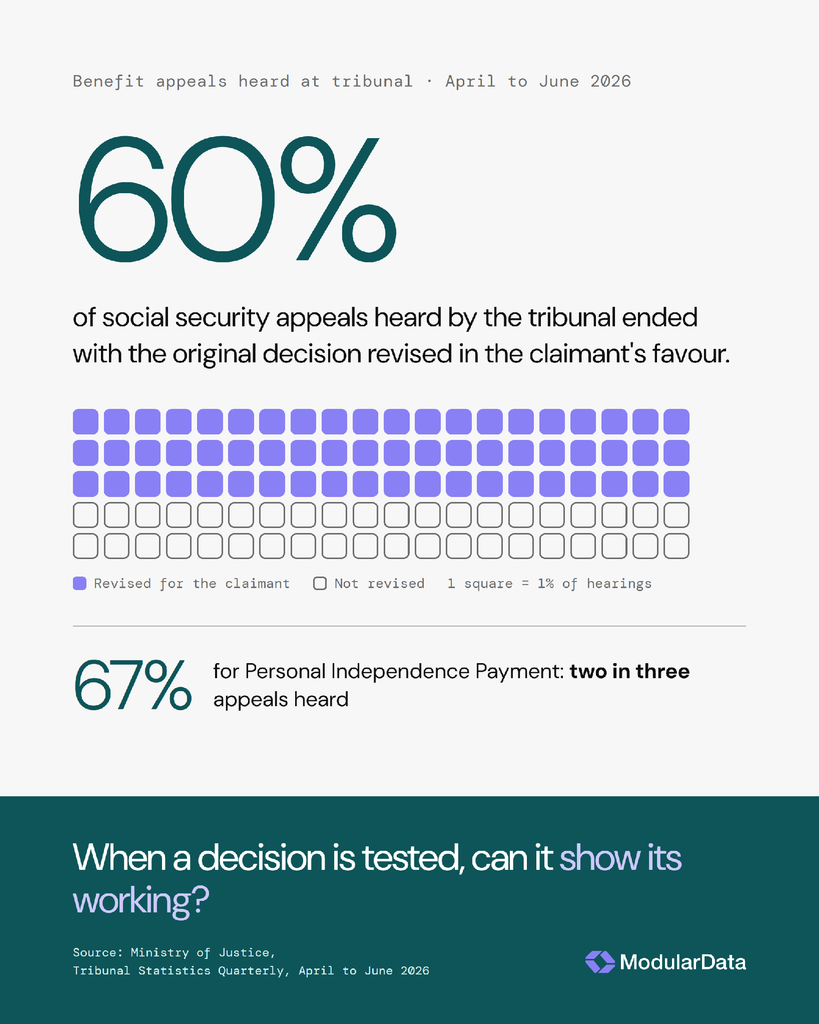
Benefit appeals heard at tribunal, April to June 2026. Source: Ministry of Justice.
A decision is already a graph
Take a request for an education, health and care (EHC) needs assessment. A parent writes to the council. The council gathers evidence from the school and from professionals who already know the child. An officer applies the legal test: does the child have, or may they have, special educational needs, and may they need provision through a plan? The council has six weeks from the day the request arrived to decide.
Each of those things is a point, and each link between them is a line:
- this fact came from this report;
- this report was received on this date;
- this test applied on this date;
- this officer decided, relying on these facts.
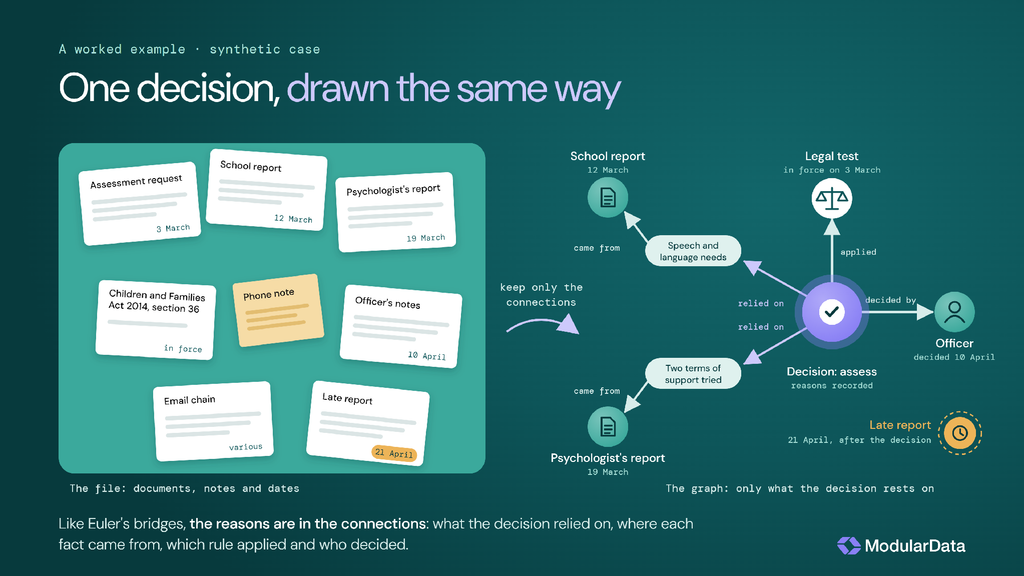
The same idea applied to one decision: a synthetic worked example.
Today those links live in case notes, inboxes and people’s memories. When a council decides not to assess, the regulations require it to tell the family the decision and their right to appeal. They do not spell out that it must give its reasons. A family can learn very little from a letter that says “refused”. The next officer, the auditor or the tribunal then has to rebuild the decision trail from fragments.
We have seen what happens when decisions lose touch with their evidence. In Australia, the Robodebt scheme raised welfare debts automatically from averaged income data. The Royal Commission that examined it called the scheme “a crude and cruel mechanism, neither fair nor legal”. The lesson is not that automation is bad. It is that a decision which cannot show its working cannot be trusted, however it was made.
Five questions a decision graph can answer
When a decision is recorded as a graph, with evidence, people, rules and time as connected records, it can answer the questions that assurance actually asks:
- What did the decision rest on? Follow the links from the decision to the facts it relied on, and to the facts it set aside.
- Where did each fact come from? Every fact points back to the document it came from, the version of that document, and who recorded it.
- What was known at the time? Each record carries the moment it became known. Evidence that arrives after the decision shows as late, and visibly played no part in it. History is not quietly rewritten.
- Which rule applied? Law and policy change. The graph records which version was in force on the date that mattered.
- The person who decided and their reasons are on the record, and so is every refusal, gap or override along the way.
None of these questions is new. Auditors, complaint handlers and tribunals ask them every day. What changes is that the answers are already joined up before anyone asks.
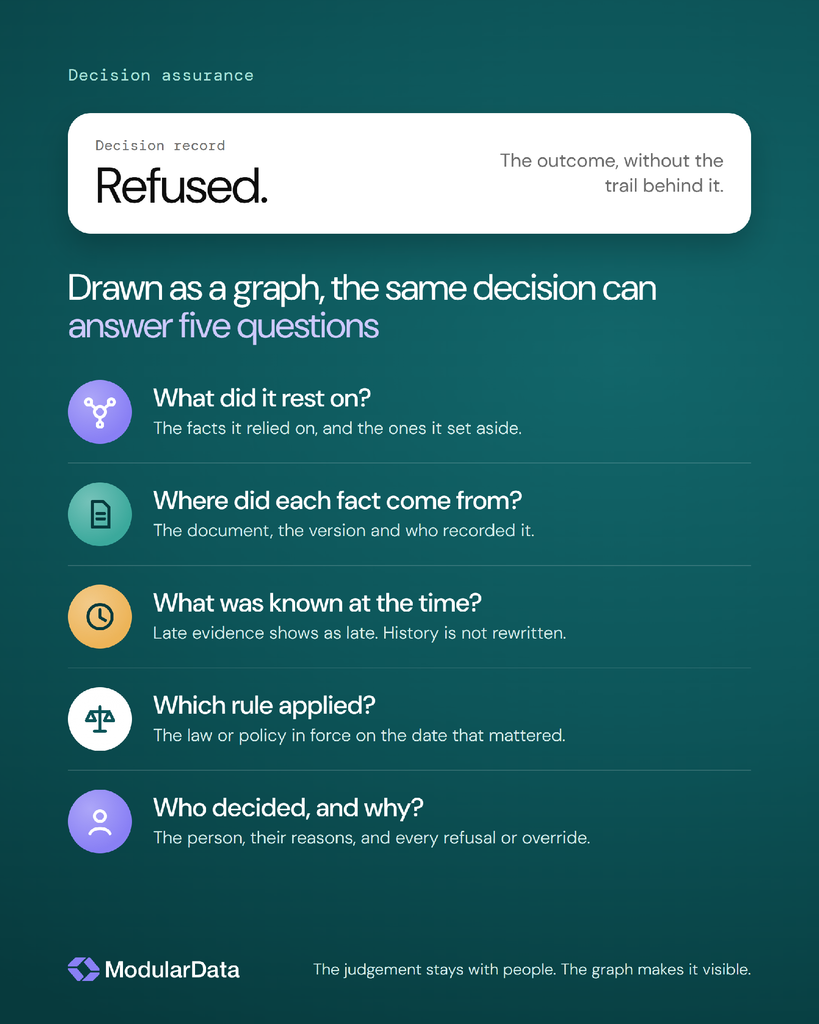
Five questions a decision graph can answer.
Assurance without sharing everything
A decision graph does not mean putting all the data in one place. The most useful ones are small: one decision, a few dozen records, readable at a glance. Links can point to evidence rather than copy it, so each organisation keeps its own records. Each person sees only what their role and purpose allow. Open standards such as W3C PROV already describe how to record where information came from, so there is no need to invent a new language.
This matters because the people around a child each see part of the picture. A school, a clinician and a family can contribute to one shared view without anyone handing over everything they hold.
Where AI fits, and where it does not
Graphs also give AI a safer place to work. An AI assistant can help an officer by reading a long report, checking dates or drafting a summary. Inside a decision graph, every claim it makes has to link to a fact that exists. If it cannot cite, it cannot claim. Its suggestion is recorded as a suggestion, and the officer’s decision is recorded as the officer’s.
The rules point the same way. The Algorithmic Transparency Recording Standard asks public bodies to publish clear information about the algorithmic tools they use. Since February 2026, the UK GDPR, as amended by the Data (Use and Access) Act 2025, has required safeguards for significant decisions taken with no meaningful human involvement: people must be told about the decision, and be able to make representations, obtain human intervention and contest it. Where a person does decide, their involvement has to be real, and a graph can show that it was. All of this is far easier when the reasons are recorded as the decision is made, not reconstructed afterwards.
The judgement stays with people. The graph makes sure the judgement can be seen.
What we are learning with special educational needs
At Modular Data, we are exploring these ideas with special educational needs decisions. It is a good place to start. The process is set out in law, the deadlines are fixed, and the evidence comes from many people who each see a different part of the child. A few lessons stand out so far.
Time matters as much as links. Often the most useful thing a graph can show is what was known, and when. A report that arrives a week after the decision does not make the decision wrong; it raises a different question. Showing it as late, rather than folding it into the file, lets a reviewer judge the decision on what was in front of the officer at the time.
What was not used matters too. A decision is shaped as much by what it set aside as by what it relied on. Recording the evidence that was considered but not relied on, and why, shows a family that their concerns were read, and lets a tribunal see the reasoning rather than infer it.
Small is readable. It is tempting to draw everything: every child, every school, every service. That makes an impressive picture and a useless one. One decision at a time, with a few dozen records, is something an officer, a parent or an auditor can follow in minutes.
The shape travels. Request, evidence, rule, decision and reason: the same pattern appears across many public services, from benefits to licensing and planning. The vocabulary and the rules change from one service to the next; the question “why was this decided?” does not.
This is early work, and there is still a lot to learn, not least how best to show a decision’s reasons to the people who make it and to the people it affects. But it has already changed how we talk about decisions: less about the outcome, more about the path to it.
Decisions that show their working
Euler’s insight was that you do not need the whole map, only the right connections. Public decisions are the same. A family does not need every document in the file. They need to see what the decision rested on, who made it and why.
A decision that shows its working can be understood by the person it affects, defended by the organisation that made it, fairly overturned by a tribunal when it is wrong, and learned from by everyone. That is what decision assurance means, and graphs are one of the clearest ways to get there.
How does your organisation show the working behind its decisions today?
Written by Seif Nasri, Research Associate at Modular Data Ltd.
Sources and further reading
- L. Euler, Solutio problematis ad geometriam situs pertinentis, Commentarii academiae scientiarum Petropolitanae 8 (1736, published 1741): the Königsberg bridges problem.
- International Consortium of Investigative Journalists, the Panama Papers investigation (2016). https://www.icij.org/investigations/panama-papers/
- Ministry of Justice, Tribunal Statistics Quarterly: April to June 2026, social security and child support appeals. https://www.gov.uk/government/statistics/tribunals-statistics-quarterly-april-to-june-2026
- Children and Families Act 2014, section 36: assessment of education, health and care needs. https://www.legislation.gov.uk/ukpga/2014/6/section/36
- Special Educational Needs and Disability Regulations 2014, regulations 4 and 5: the six-week limit and what a council must tell a family when it decides not to assess. https://www.legislation.gov.uk/uksi/2014/1530/part/2/made
- Royal Commission into the Robodebt Scheme, Report (2023). https://robodebt.royalcommission.gov.au/
- W3C, PROV-O: The PROV Ontology (2013). https://www.w3.org/TR/prov-o/
- Central Digital and Data Office, Algorithmic Transparency Recording Standard. https://www.gov.uk/government/collections/algorithmic-transparency-recording-standard-hub
- Data (Use and Access) Act 2025, section 80: automated decision-making, Articles 22A to 22D of the UK GDPR. https://www.legislation.gov.uk/ukpga/2025/18/section/80